GPS
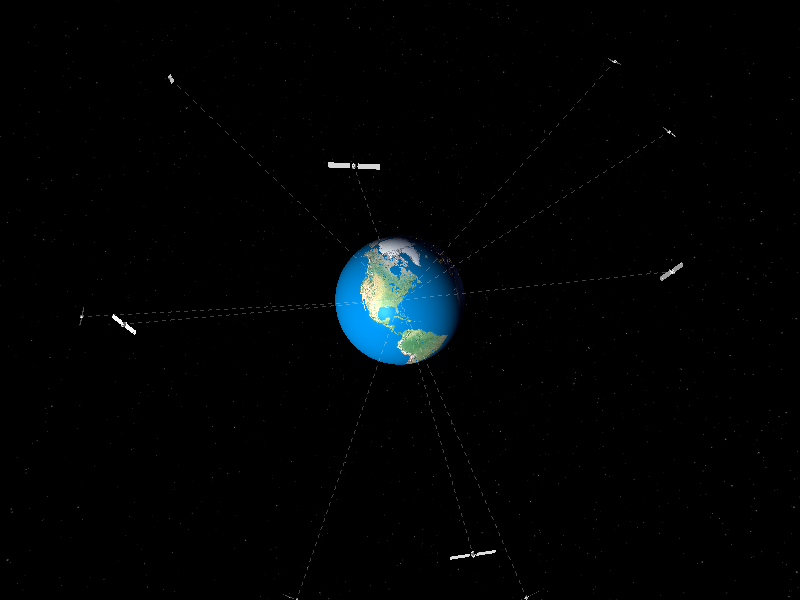
Real-time 3D renderings of GPS satellite locations.
Discussion
Preface: I've been working on an OpenGL library for Python called pg.
I overheard some of my co-workers talking about GPS and how it works. This gave me an idea that it would be cool to plot the GPS satellite positions in 3D using pg. I haven't worked with GPS much, so I wasn't totally sure it was doable.
Hardware
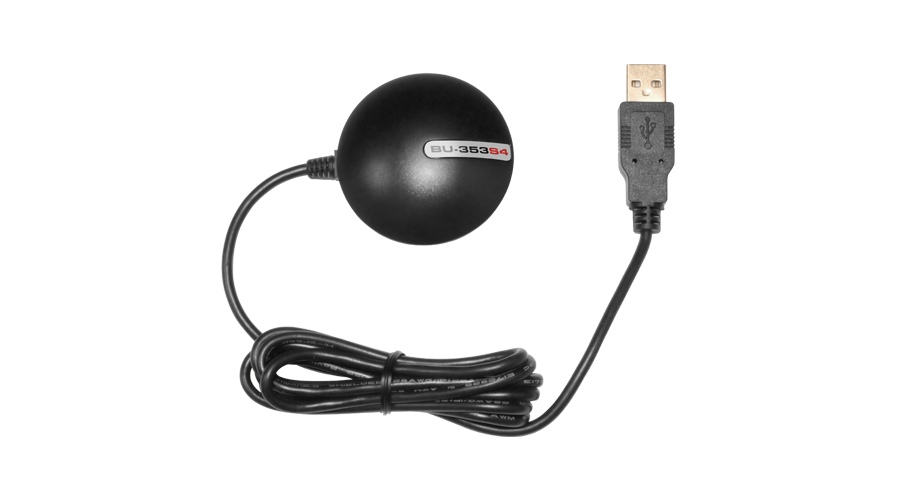
First, I pulled up Amazon and searched for a USB GPS receiver. I found one that looked pretty good and it was only $35. I didn't bother doing much research as it had good reviews and people mentioned reading data from it in Linux. So I just ordered it and hoped it would do what I wanted.
The device I am using is the GlobalSat BU-353-S4 USB GPS Receiver.
NMEA 0183
Once my hardware arrived, I installed the drivers and connected to the device using pyserial. Pretty soon I was reading NMEA "sentences". This is basically an ASCII, line-based protocol with all of the GPS data.
I found this manual which documents the different types of messages: NMEA 0183
I found that the $GPGSV message type includes the elevation and azimuth of
visible satellites. Score! With a little Googling, I also found that GPS
satellites orbit at an altitude of 20,200 km, so this is all I need to plot
the 3D positions of the satellites.
My next step was to write a parser to decode the NMEA sentences. Here is the module that I wrote: gps.py
Trigonometry
I next worked out a little math on paper to take an observer's latitude and longitude along with the satellite elevation and azimuth to determine the 3D coordinates of the satellite. This was a real head-scratcher until my friend reminded me of the law of sines.
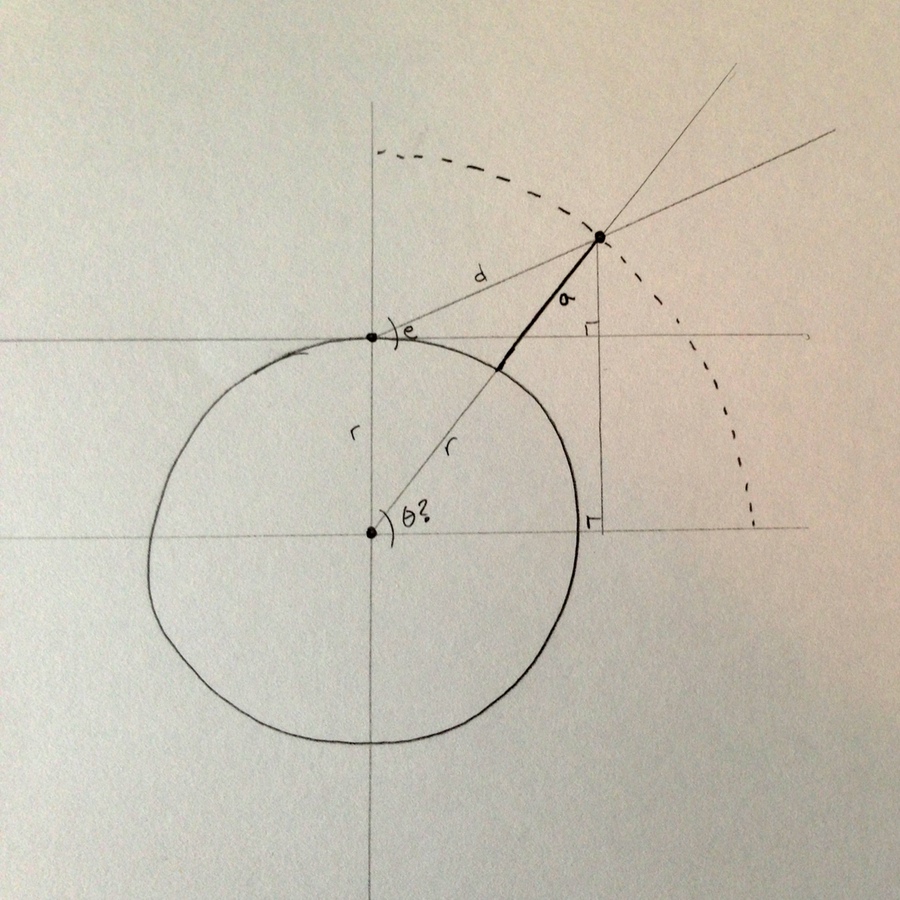
def to_xyz(latitude, longitude, elevation, azimuth):
    r1 = EARTH_RADIUS
    r2 = r1 + SATELLITE_ALTITUDE
    aa = radians(elevation) + pi / 2
    ar = asin(r1 * sin(aa) / r2)
    ad = pi - aa - ar
    angle = pi / 2 - ad
    x = cos(angle) * r2
    z = sin(angle) * r2
    matrix = pg.Matrix()
    matrix = matrix.rotate((0, 0, -1), pi / 2 - radians(azimuth))
    matrix = matrix.rotate((-1, 0, 0), -radians(latitude))
    matrix = matrix.rotate((0, -1, 0), radians(longitude))
    return matrix * (x, 0, z)
Rendering
Finally I had all of the pieces I needed to build the 3D visualization. Most of the effort here was in making it look nice. I found high-resolution textures of the Earth - one for day and one for night. My shader mixes the two textures based on the diffuse lighting factor from the sun.
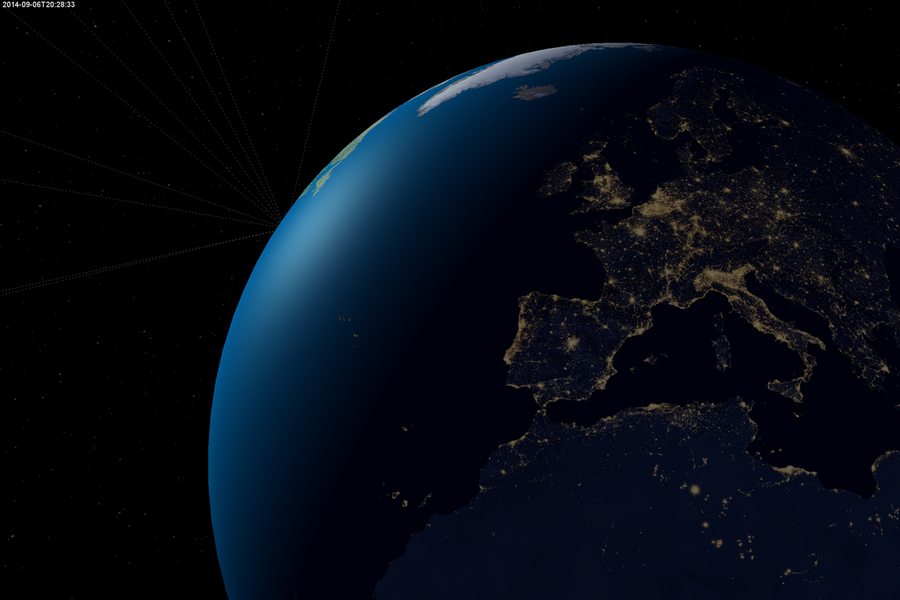
I also found a texture of stars and put in a simple sky box (sphere actually) using that texture.
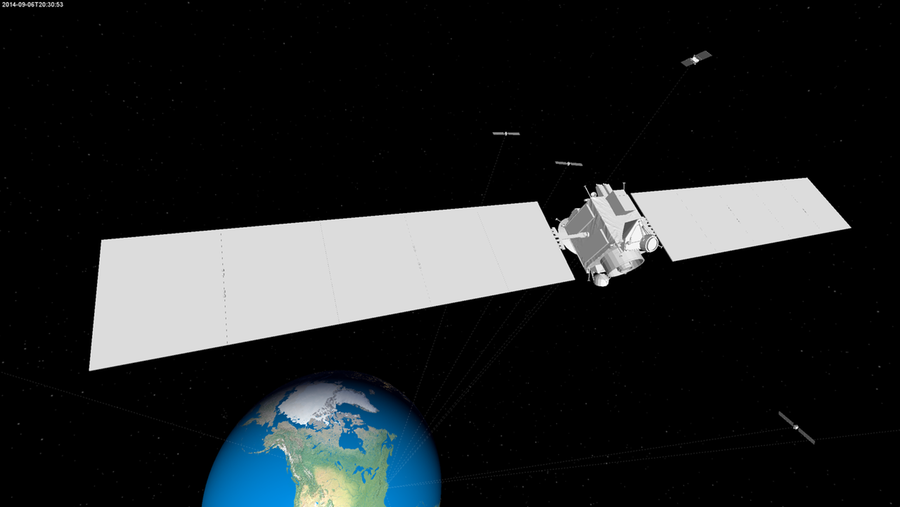
For the satellites, I'm currently using a 3D .stl model of the Dawn spacecraft (not a GPS satellite) until I can find something better.
Here is the code for the visualizer: main.py
Sun Position
Next I wanted my light source to properly model the actual position of the sun. I originally wrote my own code for this based on some pseudo-code I found online. But then I found the excellent PyEphem which does it more accurately and with a very simple API!
observer = ephem.Observer()
observer.lat = radians(latitude)
observer.lon = radians(longitude)
sun = ephem.Sun(observer)
elevation = degrees(sun.alt)
azimuth = degrees(sun.az)
Next Steps
- Log satellite positions over time and render their paths in space.
- Automatically position camera at interesting points of view.
- Label satellites with their PRN, elevation, azimuth, etc.
- Label observer's latitude, longitude, elevation, etc.
- Screensaver?


